LifeCycle®
LifeCycle
®
User Manual
6.2 Cash Flow
The Cash Flow screen shows projected values into the future. Users can review expected income, bills, spending, 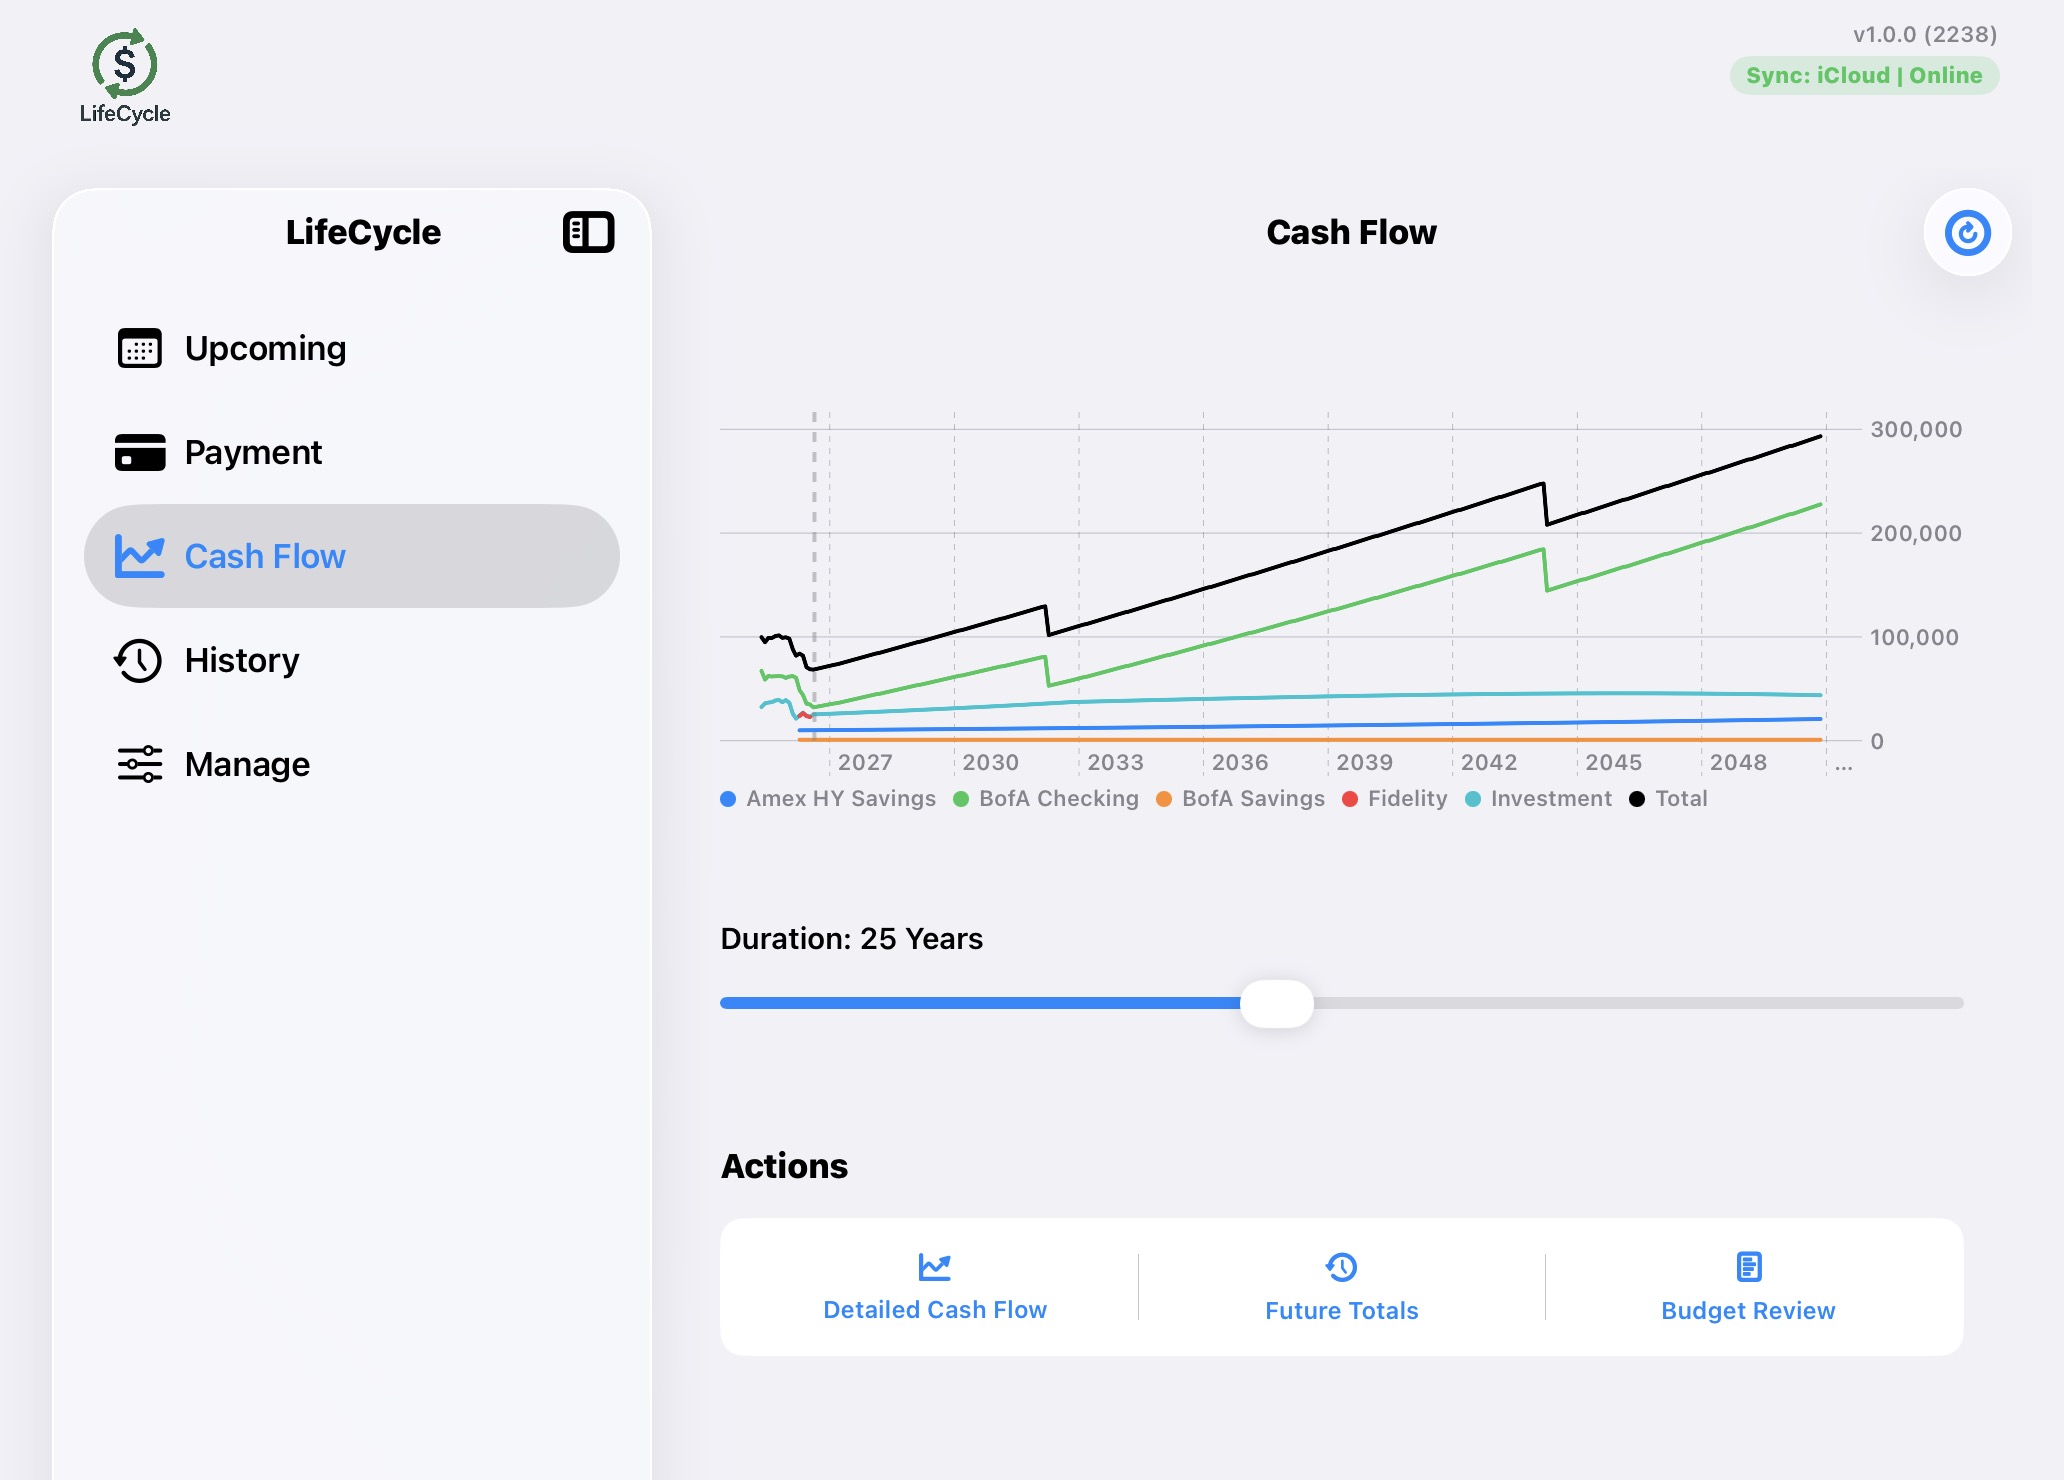 and account changes over a selected number of years.
- Contains a chart showing future values.
- Includes a slider that lets the user choose how many years to calculate.
- Uses a default projection length that can be set in Settings.
- Includes sub-pages for Detailed Cash Flow and Future Totals, which will be defined later in this manual.
With this page the user can quickly see how account money will rise or fall into the future. If your spend (bills) is too large, the graphs will eventually trend down until they hit $0.00. If your growth is good, as in this chart, then your chart will rise into the future.
The Slider
You may move the slider to the left or right to change the duration; the chart will redraw for the duration you choose
Refresh
The circular arrow in the upper right will refresh the chart. There are times when you make manual changes to numbers that the chart doesn't update. You can refresh the chart to take into account the current status of all values that you may have manuall changed (the chart will update for any payments or received incomes).